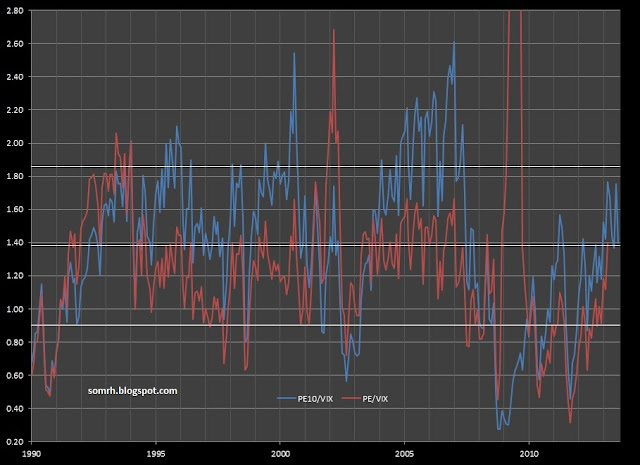
I took a look at this using data from Robert Shiller and yahoo finance:
I added lines for the mean and 1 standard deviation from the mean for the PE10 figure. The PE figure isn't as smooth. There's a large jump in 2009 due to earnings falling low resulting in high PEs. Just for reference, the mean PE to VIX came out to 1.27 and the standard deviation to 0.54. That would put markers between about 0.73 and 1.81.
There are a number of methodological considerations here. Let's look at a few of these.
How are the quantities measured?
1) VIX: While we both used VIX index, I took the monthly figure given by Yahoo Finance while Bianco took the average quarterly figure. His figure is probably a bit smoother which eliminates some noise.
2) P/E: There are also differences in how P/E is measured. I looked at both PE10 and PE (which I think Shiller's earnings figures are not trailing but current). I'm guessing Bianco's figure was a trailing PE.
What is the data set?
3) Bianco's data set appears to go from 1998-2013. My data set goes back to 1990.
What makes the PE to VIX ratio an indicator of "complacency" or "skepticism"?
4) With regard to PE, it generally reflects two things: prevailing interest rates and expected growth rates. So if expected growth rates are high, PEs will be high.
5) With regard to the VIX, it's often called the "fear index" but I think that's an oversimplification. Volatility goes both ways, both up and down. So high volatility expectations may be an indication of expectations of future growth, not decline.
Where ought the P/E to VIX ratio be?
6) I'm not sure how Bianco decided on his 1.2 for "complacent" and 0.8 for "skeptical". My 1 standard deviation criteria seems to be pretty close to reproducing his results. But that would imply we aren't there yet as for as complacent. Why should the cut-offs be there (or with my chart, at the 1 standard deviation mark) and not some other place?
So are you complacent or skeptical?
And my question here is actually not about whether or not you are complacent of skeptical, with respect to the market. But how do you respond to these sorts of charts? It's easy to take, as given, a thesis being presented without much consideration (to wit, be complacent). I think a healthy dose of skepticism should be used. It's easy to look at charts without much thought and take for granted the measurements involved, the calculations performed, the data looked at (or ignored) and go along with the story being told.
That doesn't mean this is necessarily a bad indicator. But I think there are some important considerations that should not be overlooked.


No comments:
Post a Comment
Some common OpenID URLs (no change to URL required):
Google: https://www.google.com/accounts/o8/id
Yahoo: http://me.yahoo.com/