
My findings indicated that the underlying assumptions of the Black-Scholes pricing model are inconsistent with the mean-variance view of risk. This was not an empirical result, mind you. Empirically, I've yet to find a single set of financial data that was normally distributed. It was a theoretical result; the theory is inconsistent with a mean-variance view of risk and return.
Today I'll be looking at some odd empirical results. I wanted to see what actual returns actually looked like. As it turns out, they're even worse than what the theory predicts.
My "Experiment"
So initially, I created a couple of charts that look like these:


These show what expected option returns on one year call and put options will look like if you assume that the underlying stock is currently trading at \$100 and has returns which follow follows a normal distribution with a mean and standard deviation of $\mu=8\%$ and $\sigma=16\%$.
The call option returns were the most troubling to me. As you move up to higher strike prices, returns go higher until they go lower.
But what do the results look like empirically?
Since nobody wants to finance any of the research I do, I'm left constructing data sets from things freely available. Fortunately, CBOE has a VIX index and that will, at least, allow me to construct ATM option prices on the S&P 500.
So I assumed that every third Friday I could buy a call (or put) option whose strike price is identical to Friday's closing price and has an implied volatility given by VIX. I then hold that option until the next third Friday (when it expires) and calculate the returns.
Interestingly, the S&P 500 monthly price returns work out (annually) to have a mean and standard deviation of $\mu=8.29\%$ and $\sigma=16.12\%$, respectively. That's pretty close to the assumptions above.
Now, using some functions from my Excel Financial Add-In, the theory would predict that expected monthly call returns will be 17.32% and put returns will be -15.44%. This is what they actually looked like:

Both call options and put options returned far less than what the theory expected. In fact, call option returns were negative, on average.
If you want to check out the data, I uploaded it to Google Drive: S&P 500 Option Returns
The entire distribution is interesting as well:

About 3 in 5 put options expired worthless while only 2 in 5 call options did. There were a pretty good number of 100%+ returns for both calls and puts but not enough to offset all of the losses.
Now at this point, I haven't made any adjustments for things like transaction costs and bid/ask spreads so the actual returns for a real portfolio would likely be worse.
So at this point I figured I must be doing something wrong. The empirical results can't be that bad!
. . .
Oh But They Can!
So I came across this paper: Stock Option Returns: A Puzzle.
Sophie Xiaoyan Ni looks at option returns from 1996 to 2005 but includes all US stocks which have options on them. She examines five different strike groups (calculated by taking the strike price divided by the stock price, $K/S$). Here are the mean monthly returns:
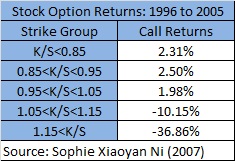
The ATM options have lower returns than the previous strike group. The first OTM group is already negative and it just gets worse.
What's the Explanation?
I'm not sure. But here's something interesting. This is a chart of VIX as well as 1 year subsequent price volatilizes (I just looked at the monthly data).

VIX tends to be higher and there appears there may be a bit of a lag. That might lead to high priced options and, thus, lower returns.
Sophie Xiaoyan Ni suggests that investor risk seeking is resulting in higher option prices.


No comments:
Post a Comment
Some common OpenID URLs (no change to URL required):
Google: https://www.google.com/accounts/o8/id
Yahoo: http://me.yahoo.com/